A major responsibility of the technology consultant is managing client risk. All too often, our industry is viewed as a sort of black magic; lacking empirical methods on how to achieve desired outcomes and relying on processes based solely on expert opinion.
This is how many video walls are designed today: utilizing a mix of past experience and intuition despite being in an industry with roots in math and engineering. This disconnect is exactly what TAD project manager, Richard Coley, felt during his time working on a large video wall project where three AV consulting firms proposed three vastly different video wall designs. The resulting frustration and confusion with the lack of performance specifications inspired Richard to reach out to several industry leaders for a solution.

Through his outreach, Richard connected with James Fife, of RP Visual Solutions, who has spent years combing through the visual sciences for formulas and measurement techniques that relate to human optical ergonomics. These formulas existed in James’ collection in a complex process that was not easily replicable. This is where Richard’s experience as a consultant proved valuable. He was able to help pair down the formulas in the process, revealing a single repeatable design method that is applicable to the majority of large display design scenarios.
While organizing these formulas, James and Richard went back and forth debating on the best starting point and in true TAD fashion, went back to “why” these displays were being put in in the first place – the end-user and their content requirements.
Through trial and error, Richard and James created a novel process to achieve optimal display quality that follows a structured empirical approach, based on AVIXA standards and visual sciences. It produces display performance requirements and measurable criteria for verification.
By leveraging TAD’s multidisciplinary understanding of IT monitoring technologies and the user experience, we have shifted the typical platform focus away from performance and towards the human experience. This way, we provide a complete digital transformation, resulting in a bespoke solution with complete visibility into asset management, network monitoring, automated ticking, and data warehouses all in one program.
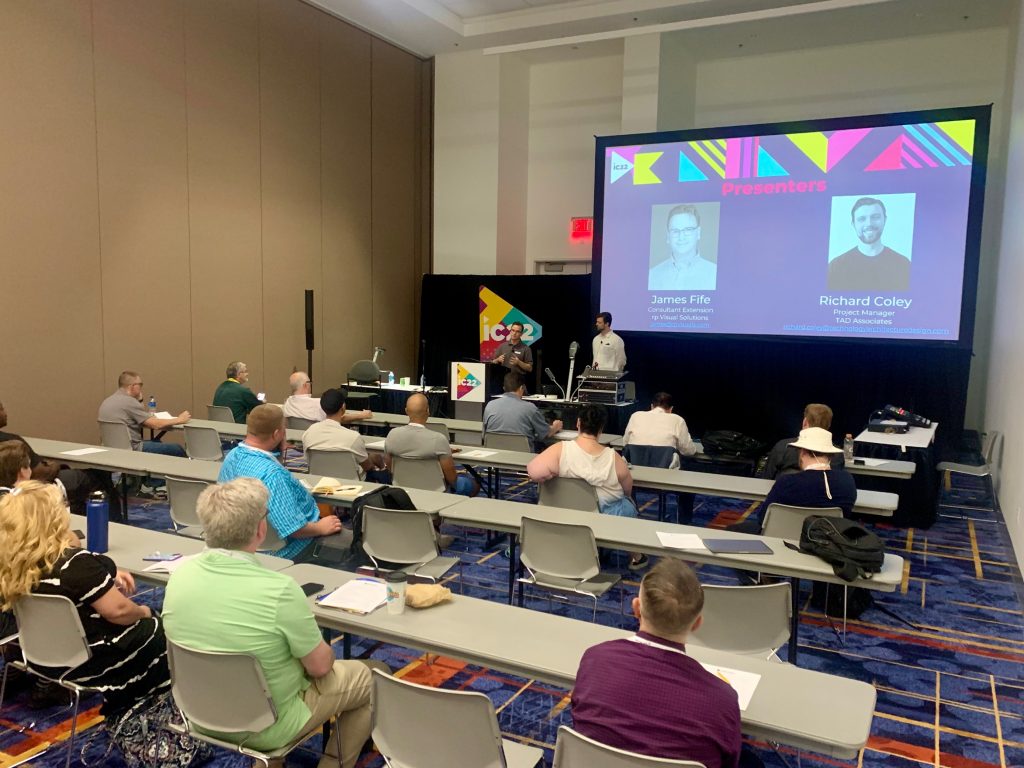
At InfoComm 2022, Richard and James had the opportunity to teach a class on this subject matter. During their class, “Designing Large Format Displays” they shared their new method by presenting the necessary formulas and their seven-step process for display technologies, outlined here:
- Define Viewing and Content Requirements
- Calculate Screen Size (Image Height) For Furthest Viewer
- Calculate Smallest Element Height
- Calculate Visual Acuity (Pixel Density) for Nearest Viewer
- Calculate Visual Acuity (Pixel Density) for Ideal Viewer
- Calculate Task Luminance / Display Brightness
- Calculate Projector Power
- Calculate Contrast Ratio
Below is a sample of the performance specifications for a typical boardroom that Richard and James worked through, where the furthest viewer is 27 feet from the display, the room lighting is set for 30-foot candles for non-video conferencing and 40-foot candles for video conferencing. By using the given viewing and content requirements and their 7-step process, Richard and James were able to identify three possible display options for their example project, shown below.
Values | Projection | LCD Flat Panels | DvLED |
Image Height, IH | 53.93” | 53.93” | 53.93” |
Planned Resolution | HD (1080 pixel tall) | 1080 x 2 | 1080 |
Calculated p, IH / resolution | 1.2683mm | 0.6341mm | 1.2683 |
Fill factor | 0.87 | 0.7-0.8 | 0.235 |
Smallest Element Height size | 41mm | 41mm | 41mm |
Smallest Element Font Size | 32 Pixel = 24 Pt | 32 Pixel = 24 Pt | 32 Pixel = 24 Pt |
Nearest Viewer | 11.5” | 14” | 88.3” |
Ideal Viewer | 183.3” | 99.9” | 260.1” |
DISCAS Furthest Viewer | 323.6” | 323.6” | 323.6” |
Task Luminance cd/m2 (30fc / 40fc) *Maximum Screen Brightness* | 307.5 / 411 | 307.5 / 411 | 307.5 / 411 |
Projection Lumen w/ ALR Screen (30fc / 40fc) | 4852 / 6462 | n/a | n/a |
Contrast Ratio at Task Luminance 3:1 | 20:1 | 299 / 181 :1 | 2796 / 3737 :1 (*307:1) |
*LED with constant ‘black’ of 1.23 cd/m2* | |||
Because multiple product options are identified, this process still allows the designer to use their expertise to guide their decision and account for project specific factors and client preferences.
Not only does this example provide the designer with three practical choices, but it also liberates the user from the millions of products that will not work for their project. Following the steps removes the fear of selecting the wrong product, providing confidence that the design of an experience will align with the desired result, especially when utilizing newly discovered manufacturers and products.
This process is a tool for designers that is based in science, rather than opinion, while leaving room to infuse intuition and expertise by identifying multiple feasible options for a project and leaving the final decision to the designer.
Throughout the industry, there are few other documented processes for the standardization of design, but TAD hopes Richard and James’ work contributes to the conversation and continues to push our industry towards a trend of shared standards that still leave room for innovation.
Please send us a request if you are interested in the complete process including formulas.